
Understanding the AI Score
What the 0–100 AI score measures, the eight signals inside it, and how to use it as a conviction gauge.
What the AI score is
The ŷRobot AI score is a single number between 0 and 100 that summarizes how consistently eight independent analytical signals point in the same direction for a stock. A score near 100 means most signals agree; a score near 0 means they mostly disagree or lean the other way. The number does not predict what a stock will do — it is a measure of agreement across models, not a forecast.
That distinction matters. Any individual signal can be wrong for reasons the models do not see: a pending acquisition, a lawsuit, or a macro event outside the data. The AI score gives you probabilistic context — a quick read on whether multiple independent lenses are aligned — so you know when conviction is broad and when it rests on just one or two factors.
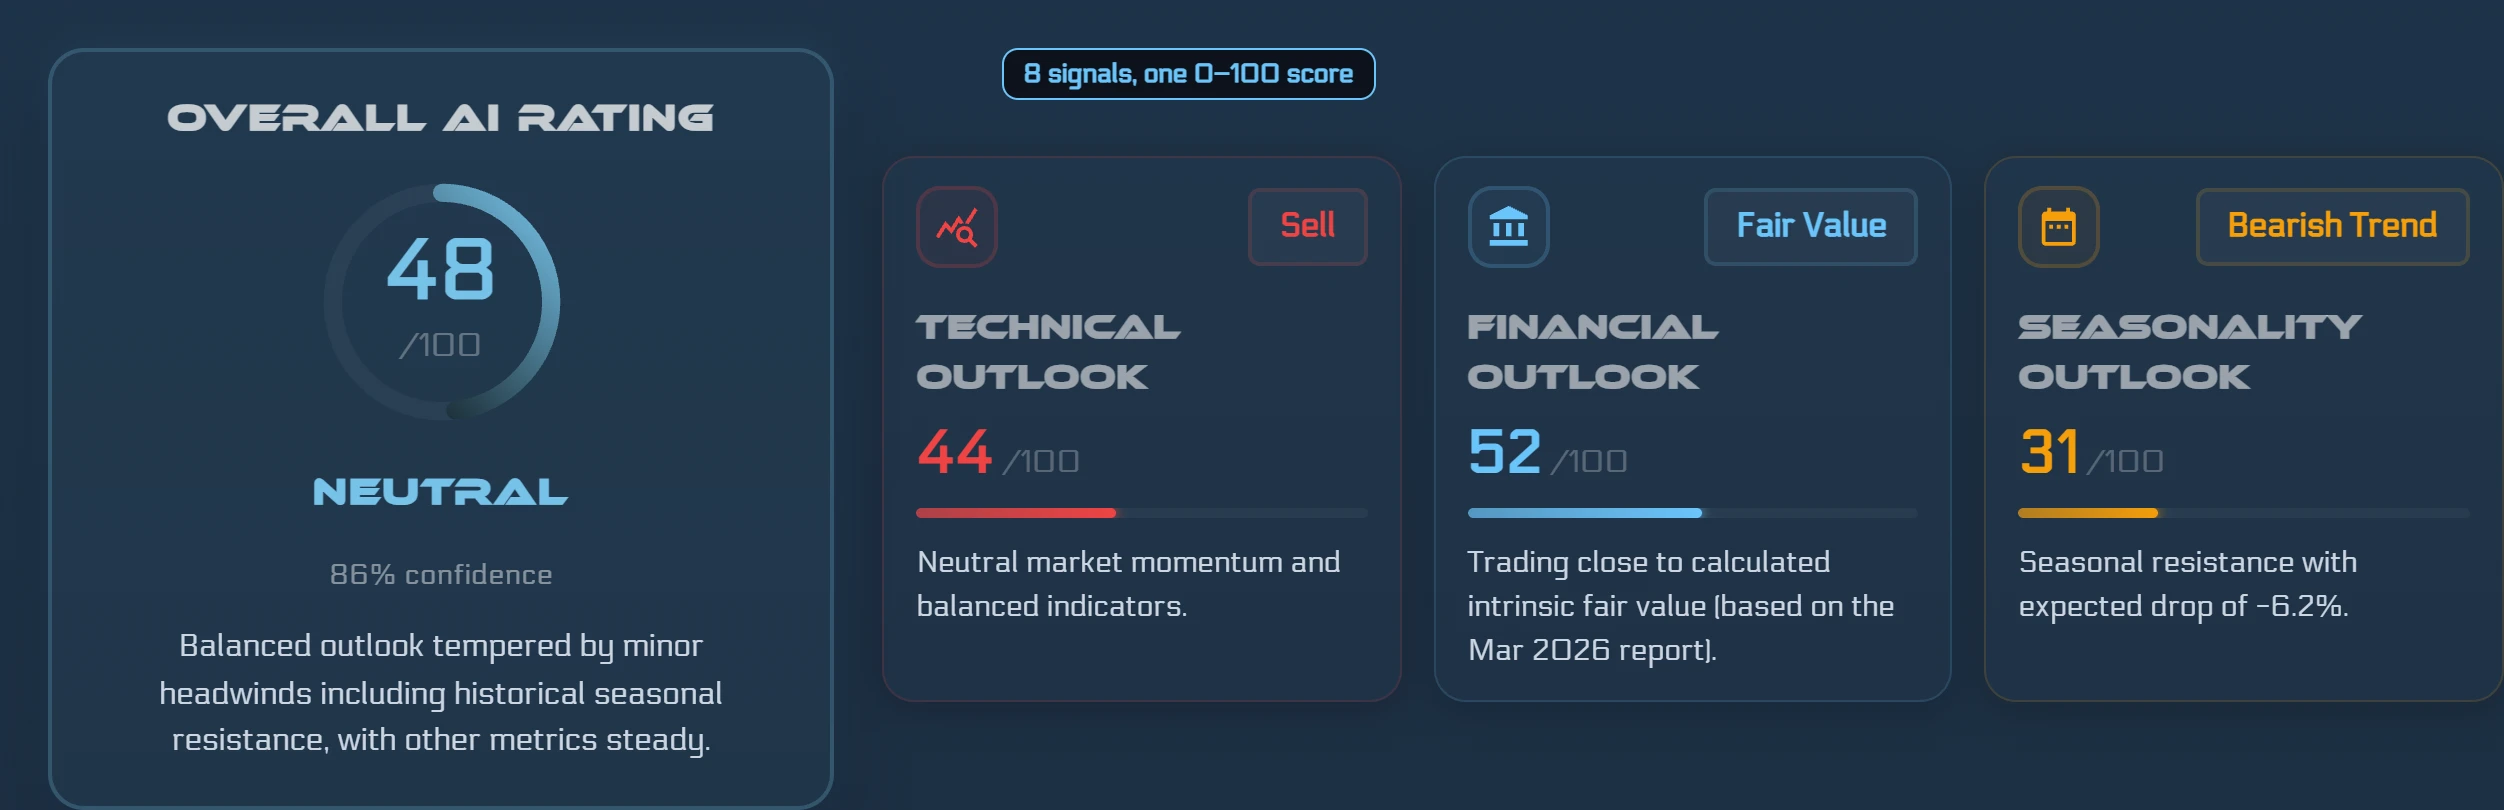
The eight components and their weights
Each component contributes a share of the final score based on how much signal it tends to carry. The breakdown is: fair-value gap 30%, forward return forecast 20%, chart-model signal 15%, fundamentals score 12%, P/E ratio vs the stock's own history 8%, analyst consensus 8%, seasonality 4%, and volatility penalty 3%.
The fair-value gap is the largest single input. ŷRobot estimates a stock's 6-month fair value using a CatBoost regression model trained on roughly 40 fundamental, growth, cash-flow, and price-momentum inputs, measures the gap between that estimate and the current price, and ranks that gap against stocks of similar size. The forward return forecast adds a separate ML model's directional view. Chart signal captures pattern recognition on price history. Fundamentals, P/E history, analyst consensus, and seasonality add context from different time horizons. Volatility acts as a penalty: high uncertainty compresses the score even when other signals agree.
Direction and confidence
Alongside the 0–100 score, ŷRobot shows a direction (positive or negative) and a confidence level. Direction uses hysteresis — it does not flip on the slightest change — so it stays stable through small oscillations in the underlying data. Confidence blends two factors: how complete the input data is for that stock, and how tightly the eight components agree with each other.
A stock with sparse data in some components will show lower confidence even if the available signals are aligned. That is intentional: the system is more certain when it has more to work with. Low confidence is not a reason to ignore the score — it is useful information about how much weight to place on it.
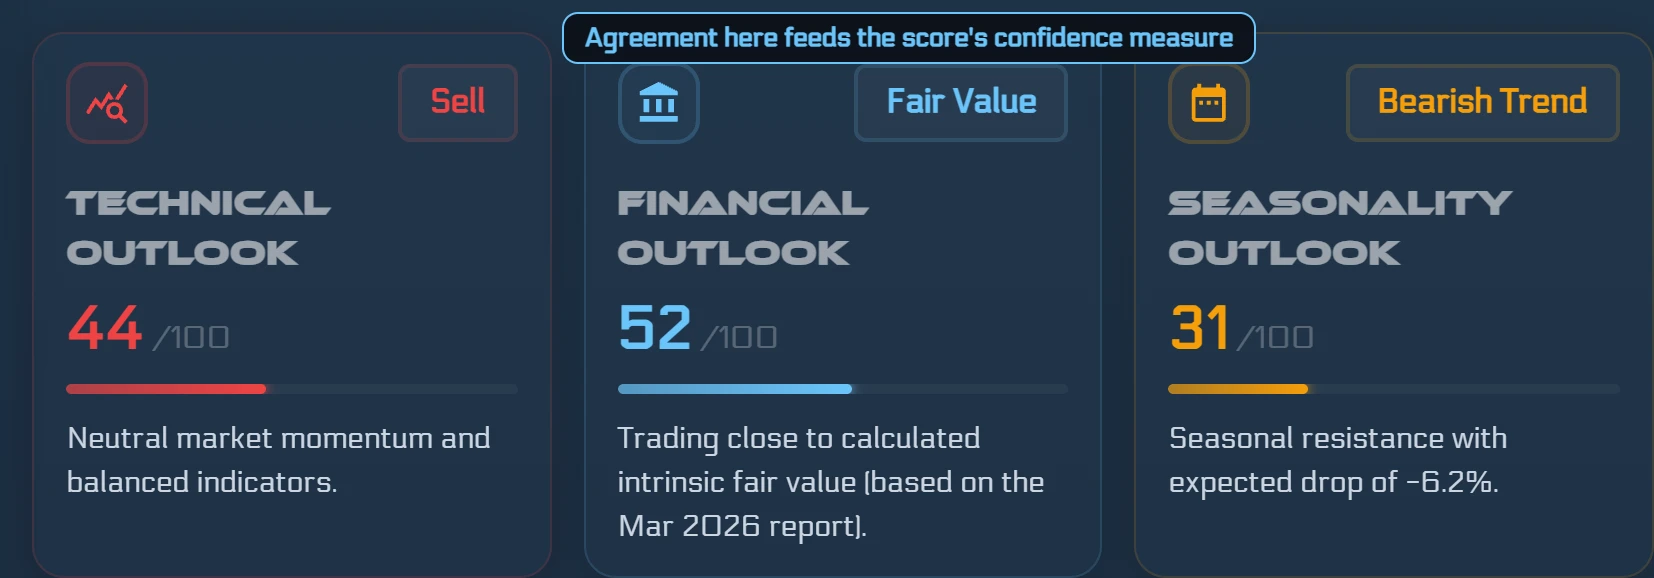
How to read it in the app
The AI Scorecard appears on every stock page at /asset-breakdown/<SYMBOL>. It breaks out each of the eight components so you can see which signals are driving a high or low composite. The Smart Screener includes an AI Score column, letting you sort and filter across the 4,000+ US stocks ŷRobot covers.
The score is designed as a starting point, not a conclusion. Because ŷRobot fuses a fundamental fair-value model, technical signals, analyst consensus, and seasonality into one number, a high score means several different analytical approaches agree — which is more informative than any single approach alone. But one strong signal can still mislead if it happens to dominate the composite. Always treat the score as an agreement gauge, and look at the individual components to understand what is driving it.
Try it on a real stock
See ŷRobot's AI Score analysis on any U.S. stock — free, no account needed.
Analyze a Stock FreeFrequently asked questions
What is a good ŷRobot AI score?
The score is a 0–100 agreement gauge across eight signals. Higher means more independent signals point the same way; it is probabilistic context, not a recommendation.
Is the AI score a buy signal?
No. ŷRobot does not issue buy or sell recommendations. The score summarizes how strongly independent models agree, and it can be wrong.
ŷRobot analysis is AI-generated and quality-gated; nothing on this page is investment advice.