
Seasonality
Seasonal tendencies are real but weak evidence — that's why they get a 4% weight.
Tendencies, not guarantees
Some stocks show recurring patterns tied to the calendar — stronger performance in certain quarters, weaker performance in others — that have persisted across multiple years of data. These patterns can arise from real business rhythms: retailers that generate a large share of annual revenue in the fourth quarter, energy companies whose demand tracks heating and cooling cycles, businesses whose earnings are concentrated around a particular season. They can also reflect broader calendar effects in market behavior.
The important word is 'tendencies.' A seasonal pattern observed in historical data is a statistical regularity, not a law. Any given year can break from the pattern for reasons that have nothing to do with the calendar — a macro shock, a company-specific development, or simply the natural variability that makes markets hard to predict. Treating seasonal tendencies as reliable forecasts is a mistake; treating them as background context worth knowing is reasonable.
ŷRobot's seasonality signal captures these tendencies by examining a stock's historical price behavior across calendar periods and extracting patterns that appear with enough consistency to justify their inclusion. The signal does not predict what will happen in a given period — it summarizes what has tended to happen, with all the uncertainty that implies.
A deliberately small weight
Seasonality carries a 4% weight in the ŷRobot AI score — the smallest positive component before the volatility penalty. That weight is not an accident. Seasonal patterns are real enough to include, but too weak and too easily broken by other factors to allow them to move the composite meaningfully. A 4% weight means a very strong seasonal signal nudges the score, without letting an unfavorable calendar period drag down a stock with otherwise solid fundamentals, valuation, and model-derived signals.
The contrast with the larger components is instructive. The fair-value gap at 30% and the return forecast at 20% are model-derived estimates that update on current data. The fundamentals component at 12% reflects the most recently reported financial health. Analyst consensus at 8% reflects current professional views. Seasonality, at 4%, is backward-looking by design — it is a pattern extracted from history, not a model of the current state of the business or its valuation. That backward-looking nature is precisely why it earns a small weight rather than a large one.
Including seasonality at a small weight rather than excluding it entirely reflects a judgment that even weak evidence is worth incorporating when it is honest about its weakness. A score that ignores all calendar context would be discarding real, if modest, information. A score that weighted it heavily would be overstating its reliability.
Where to see it
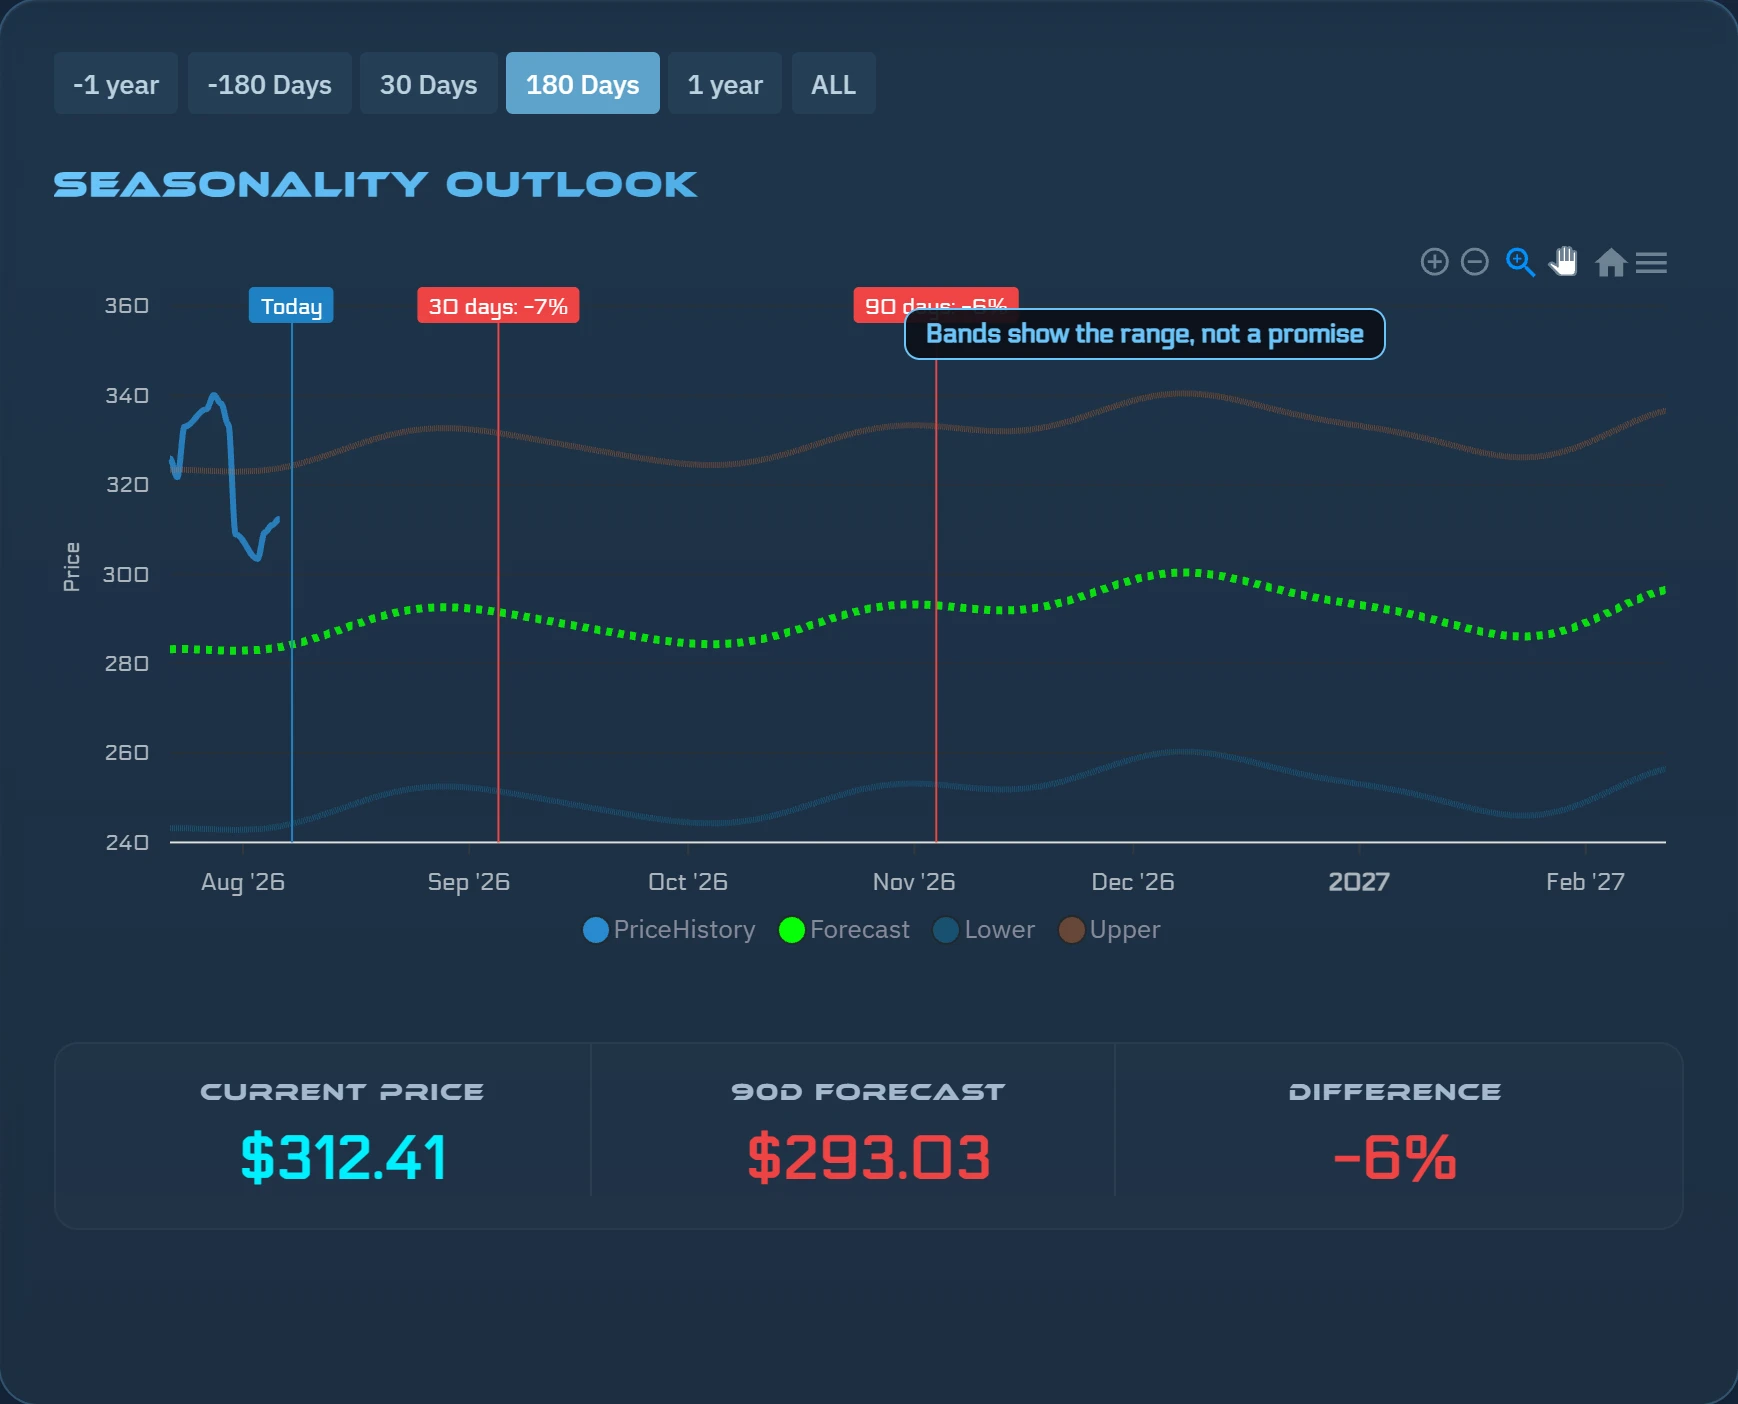
The seasonality signal is displayed under 'Seasonality Outlook' on each stock page. The Seasonality Outlook section shows the current seasonal read alongside context about the historical pattern for that stock, letting you see both the signal itself and the underlying pattern it is drawn from.
Within the AI Scorecard, seasonality appears under the Seasonality pillar, distinct from the Technical and Financial pillars. Seeing it isolated makes it easy to judge how much the seasonal component is contributing to or detracting from the composite — and whether the seasonal read is aligned with or running against the larger-weight signals that drive most of the score.
Try it on a real stock
See ŷRobot's Seasonality analysis on any U.S. stock — free, no account needed.
Analyze a Stock FreeŷRobot analysis is AI-generated and quality-gated; nothing on this page is investment advice.