
Weekly Recap: Featured Stocks, Lessons, and The Week Ahead
ŷRobot Research ·

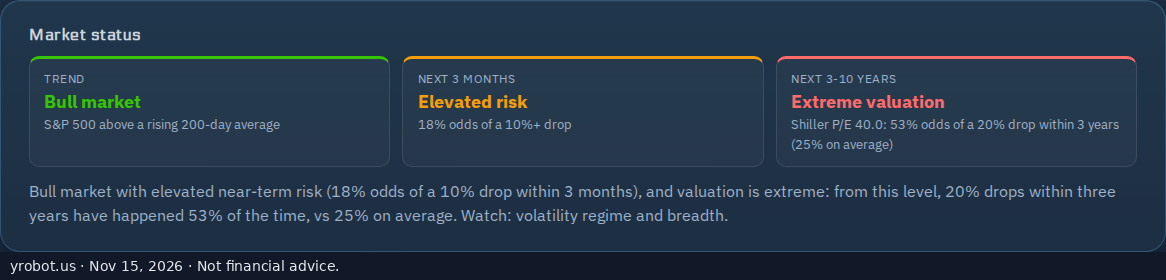
As of 2026-11-13, ŷRobot's market regime analysis indicated an "Uptrend under stress, but breadth is a concern: most stocks are in downtrends." More details are available on the Market Regime page.
The Week in Review
This past week, ŷRobot's daily analysis featured a diverse group of companies across technology, industrials, consumer discretionary, and healthcare sectors. These firms represent key areas of the economy, from semiconductor manufacturing and energy infrastructure to luxury goods and essential healthcare services. Observing their price movements provides context for the broader market's activity.
On Monday, 2026-11-09, five companies were highlighted. BE, Bloom Energy, a company focused on solid oxide fuel cell technology for clean energy generation, was featured when its price was $173. By the end of the week, BE's price moved to $191.97, a change of +11.0%. TPR, Tapestry, a global house of brands including Coach and Kate Spade, was featured at $133. Its price closed the week at $132.41, moving -0.4%. COR, CoreSite Realty, a real estate investment trust specializing in data centers, was featured at $334. Its price later reached $359.19, a +7.5% move. CAH, Cardinal Health, a healthcare services and products company, was featured at $272. Its price concluded the week at $281.14, representing a +3.4% move. Finally for Monday, AXON, Axon Enterprise, known for its Taser devices, body cameras, and software solutions for public safety, was featured at $313. Its price ended the week at $315.43, a +0.8% move.
Tuesday, 2026-11-10, brought five more companies into focus. ENTG, Entegris, a supplier of materials and process solutions for the semiconductor and other high-technology industries, was featured at $140. Its price moved to $147.41 by week's end, a +5.3% change. LRCX, Lam Research, a major provider of wafer fabrication equipment and services to the semiconductor industry, was featured at $221. Its price closed at $225.92, a +2.2% move. ADI, Analog Devices, a global semiconductor company specializing in data conversion and signal processing technology, was featured at $395. Its price later settled at $397.97, a +0.8% move. TRGP, Targa Resources, a midstream energy company primarily engaged in natural gas and natural gas liquids services, was featured at $274. Its price finished the week at $297.33, a +8.5% move. CMI, Cummins, a global power leader designing, manufacturing, distributing, and servicing engines and related technologies, was featured at $466. Its price moved to $452.11, a -3.0% change.
On Wednesday, 2026-11-11, five additional stocks were highlighted. ASML, ASML Holding, a leading supplier of photolithography systems for the semiconductor industry, was featured at $1,510. Its price closed the week at $1,495.16, a -1.0% move. BCS, Barclays, a British universal bank offering financial services across retail, wholesale, and investment banking, was featured at $23.10. Its price ended the week at $22.88, a -1.0% change. HAL, Halliburton, one of the world's largest providers of products and services to the energy industry, was featured at $31.90. Its price moved to $33.78, a +5.9% change. SWK, Stanley Black & Decker, a global manufacturer of tools and storage, commercial electronic security, and engineered fastening systems, was featured at $116. Its price concluded the week at $113.28, a -2.3% move. MCHP, Microchip Technology, a provider of microcontroller, mixed-signal, analog, and Flash-IP solutions, was featured at $60.30. Its price closed at $61.68, a +2.3% move.
Thursday, 2026-11-12, saw five more companies featured. AVGO, Broadcom, a diversified global semiconductor and infrastructure software company, was featured at $345. Its price ended the week at $347.01, a +0.6% move. ONTO, Onto Innovation, a developer and manufacturer of process control tools and software for the semiconductor industry, was featured at $215. Its price moved to $203.54, a -5.3% change. FFIV, F5 Networks, a company specializing in application security, performance, and delivery, was featured at $320. Its price closed at $309.14, a -3.4% move. BKNG, Booking Holdings, a leading provider of online travel and related services, was featured at $160. Its price concluded the week at $159.58, a -0.3% move. JCI, Johnson Controls International, a global diversified technology and multi-industrial leader serving a wide range of customers in more than 150 countries, was featured at $145. Its price ended the week at $139.32, a -3.9% change.
To close out the week on Friday, 2026-11-13, five final companies were highlighted. VRT, Vertiv Holdings, a global provider of critical digital infrastructure and continuity solutions, was featured at $210. Its price moved to $202.09, a -3.8% change. CLS, Celestica, an electronics manufacturing services company, was featured at $254. Its price closed at $240.18, a -5.4% move. RYAAY, Ryanair Holdings, a major European low-cost airline, was featured at $57.90. Its price ended the week at $57.72, a -0.3% move. PWR, Quanta Services, a specialized contracting services company providing infrastructure solutions for the electric power and oil and gas industries, was featured at $606. Its price concluded the week at $602.01, a -0.7% move. Lastly, RACE, Ferrari, the iconic luxury sports car manufacturer, was featured at $405. Its price finished the week at $411.23, a +1.5% move.
This Week's Lessons
Each week, ŷRobot's analysis reinforces core principles of market observation and data interpretation. Here are some key lessons from this past week:
- Valuation gaps tend to close over quarters, not overnight. Valuation gaps close over time, not overnight
- A repeatable process beats hot predictions over the long run. Follow a repeatable process over hot predictions
- Actively traded stocks tend to have tighter spreads and lower trading costs. Liquidity reduces the cost of getting in and out
- What you paid for a stock has no bearing on what it's worth today. Don't anchor to your purchase price
- One indicator can mislead; conviction comes from several independent signals agreeing. One indicator can mislead; look for agreement
The Week Ahead
Looking forward, the upcoming week brings several earnings reports that may draw investor attention. These scheduled announcements provide specific dates for companies to release their financial results, often influencing short-term price movements.
BIDU is scheduled to report earnings on 2026-11-16. BZ is scheduled to report earnings on 2026-11-17. Historically, BZ has shown a 30-day seasonal tendency of +14.8% around its earnings reports. DY is scheduled to report earnings on 2026-11-18. Historically, DY has shown a 30-day seasonal tendency of +6.9% around its earnings reports. KEYS is scheduled to report earnings on 2026-11-19. Historically, KEYS has shown a 30-day seasonal tendency of +7.6% around its earnings reports.
These seasonal tendencies reflect historical patterns and do not predict future performance. They are simply observations of past price behavior around earnings dates.
Market Health
Bull market with elevated near-term risk (18% odds of a 10% drop within 3 months), and valuation is extreme: from this level, 20% drops within three years have happened 53% of the time, vs 25% on average. Watch: volatility regime and breadth.
- Trend: Bull market
- Next 3 months: Elevated risk (18% odds of a 10%+ drop)
- Next 3-10 years: Extreme valuation, Shiller P/E 40.0 (53% odds of a 20% drop within 3 years, 25% on average)
- What changed this week: Near-term market risk is now elevated. Term structure is back to healthy.
Lesson of the week: How likely is a 10% drop in the next 3 months?
No one can time a drop, but some conditions have come before more of them. We read seven market signals every day, turn them into one risk level, and check how often a 10% drop followed each level since 2000.
Today's signals put near-term risk at elevated. Since 2000, a 10% drop followed within 3 months 18% of the time at that level.
Tool of the week
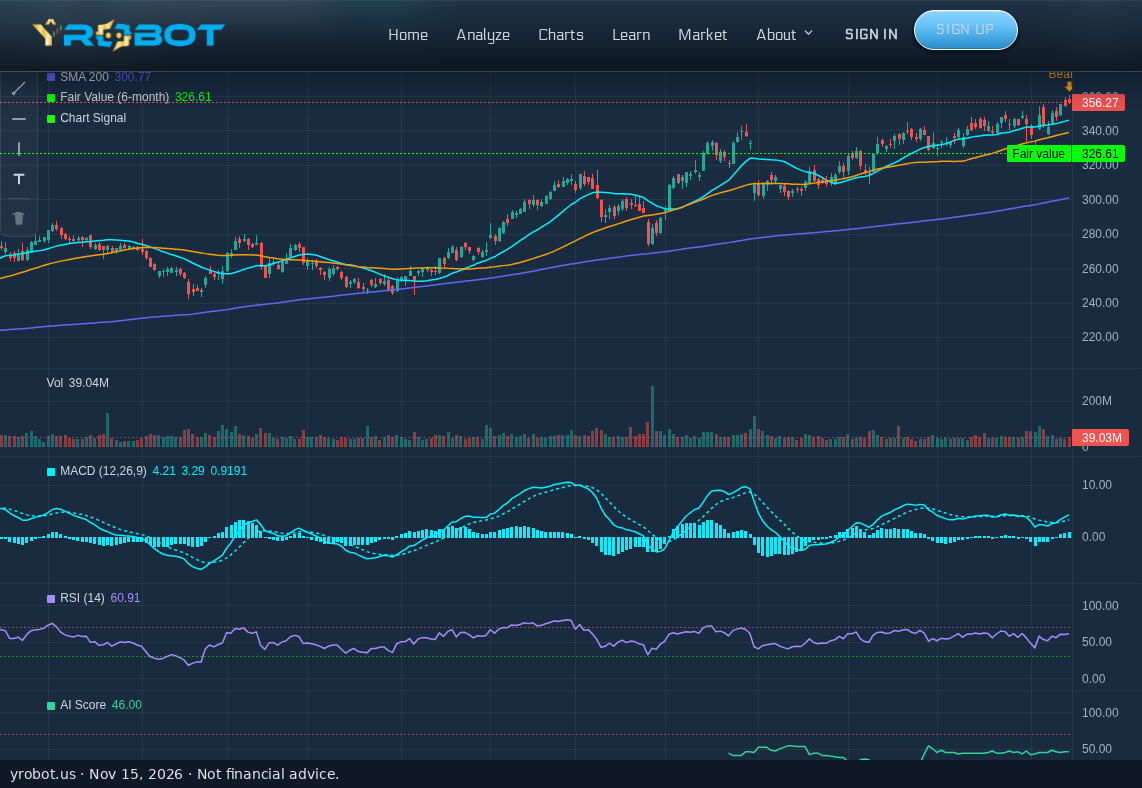
Open /chart/ plus a ticker, find the signal markers, and read the forecast band as a range, not a target. Read the guide.
Explore ŷRobot
ŷRobot is an AI-powered stock analysis platform that gives retail investors access to the same fair-value and chart-signal models featured in this article.
- Screener: Filter thousands of stocks by AI signal
- Stocks: Browse fair-value estimates across the market
- Trading Agent: Configure your own AI-driven strategy
- ŷRobot Chat: Ask our AI analyst about any stock
- Market Regime: Is it a bull or a bear market today? Seven signals, updated daily
AI-generated content disclosure: this article was generated by ŷRobot's automated analysis pipeline from the platform's own model outputs. Model outputs are statistical estimates based on historical data, are frequently wrong for individual stocks, and are not investment recommendations.
Not financial advice: all content is provided for informational purposes only and does not constitute investment, financial, or trading advice. Do your own research before making any investment decision.
ŷRobot analysis is AI-generated and quality-gated; nothing here is investment advice.