
Using the Smart Screener
Scan the whole US universe by AI score and outlooks — and use breadth to avoid over-concentration.
One table, the whole universe
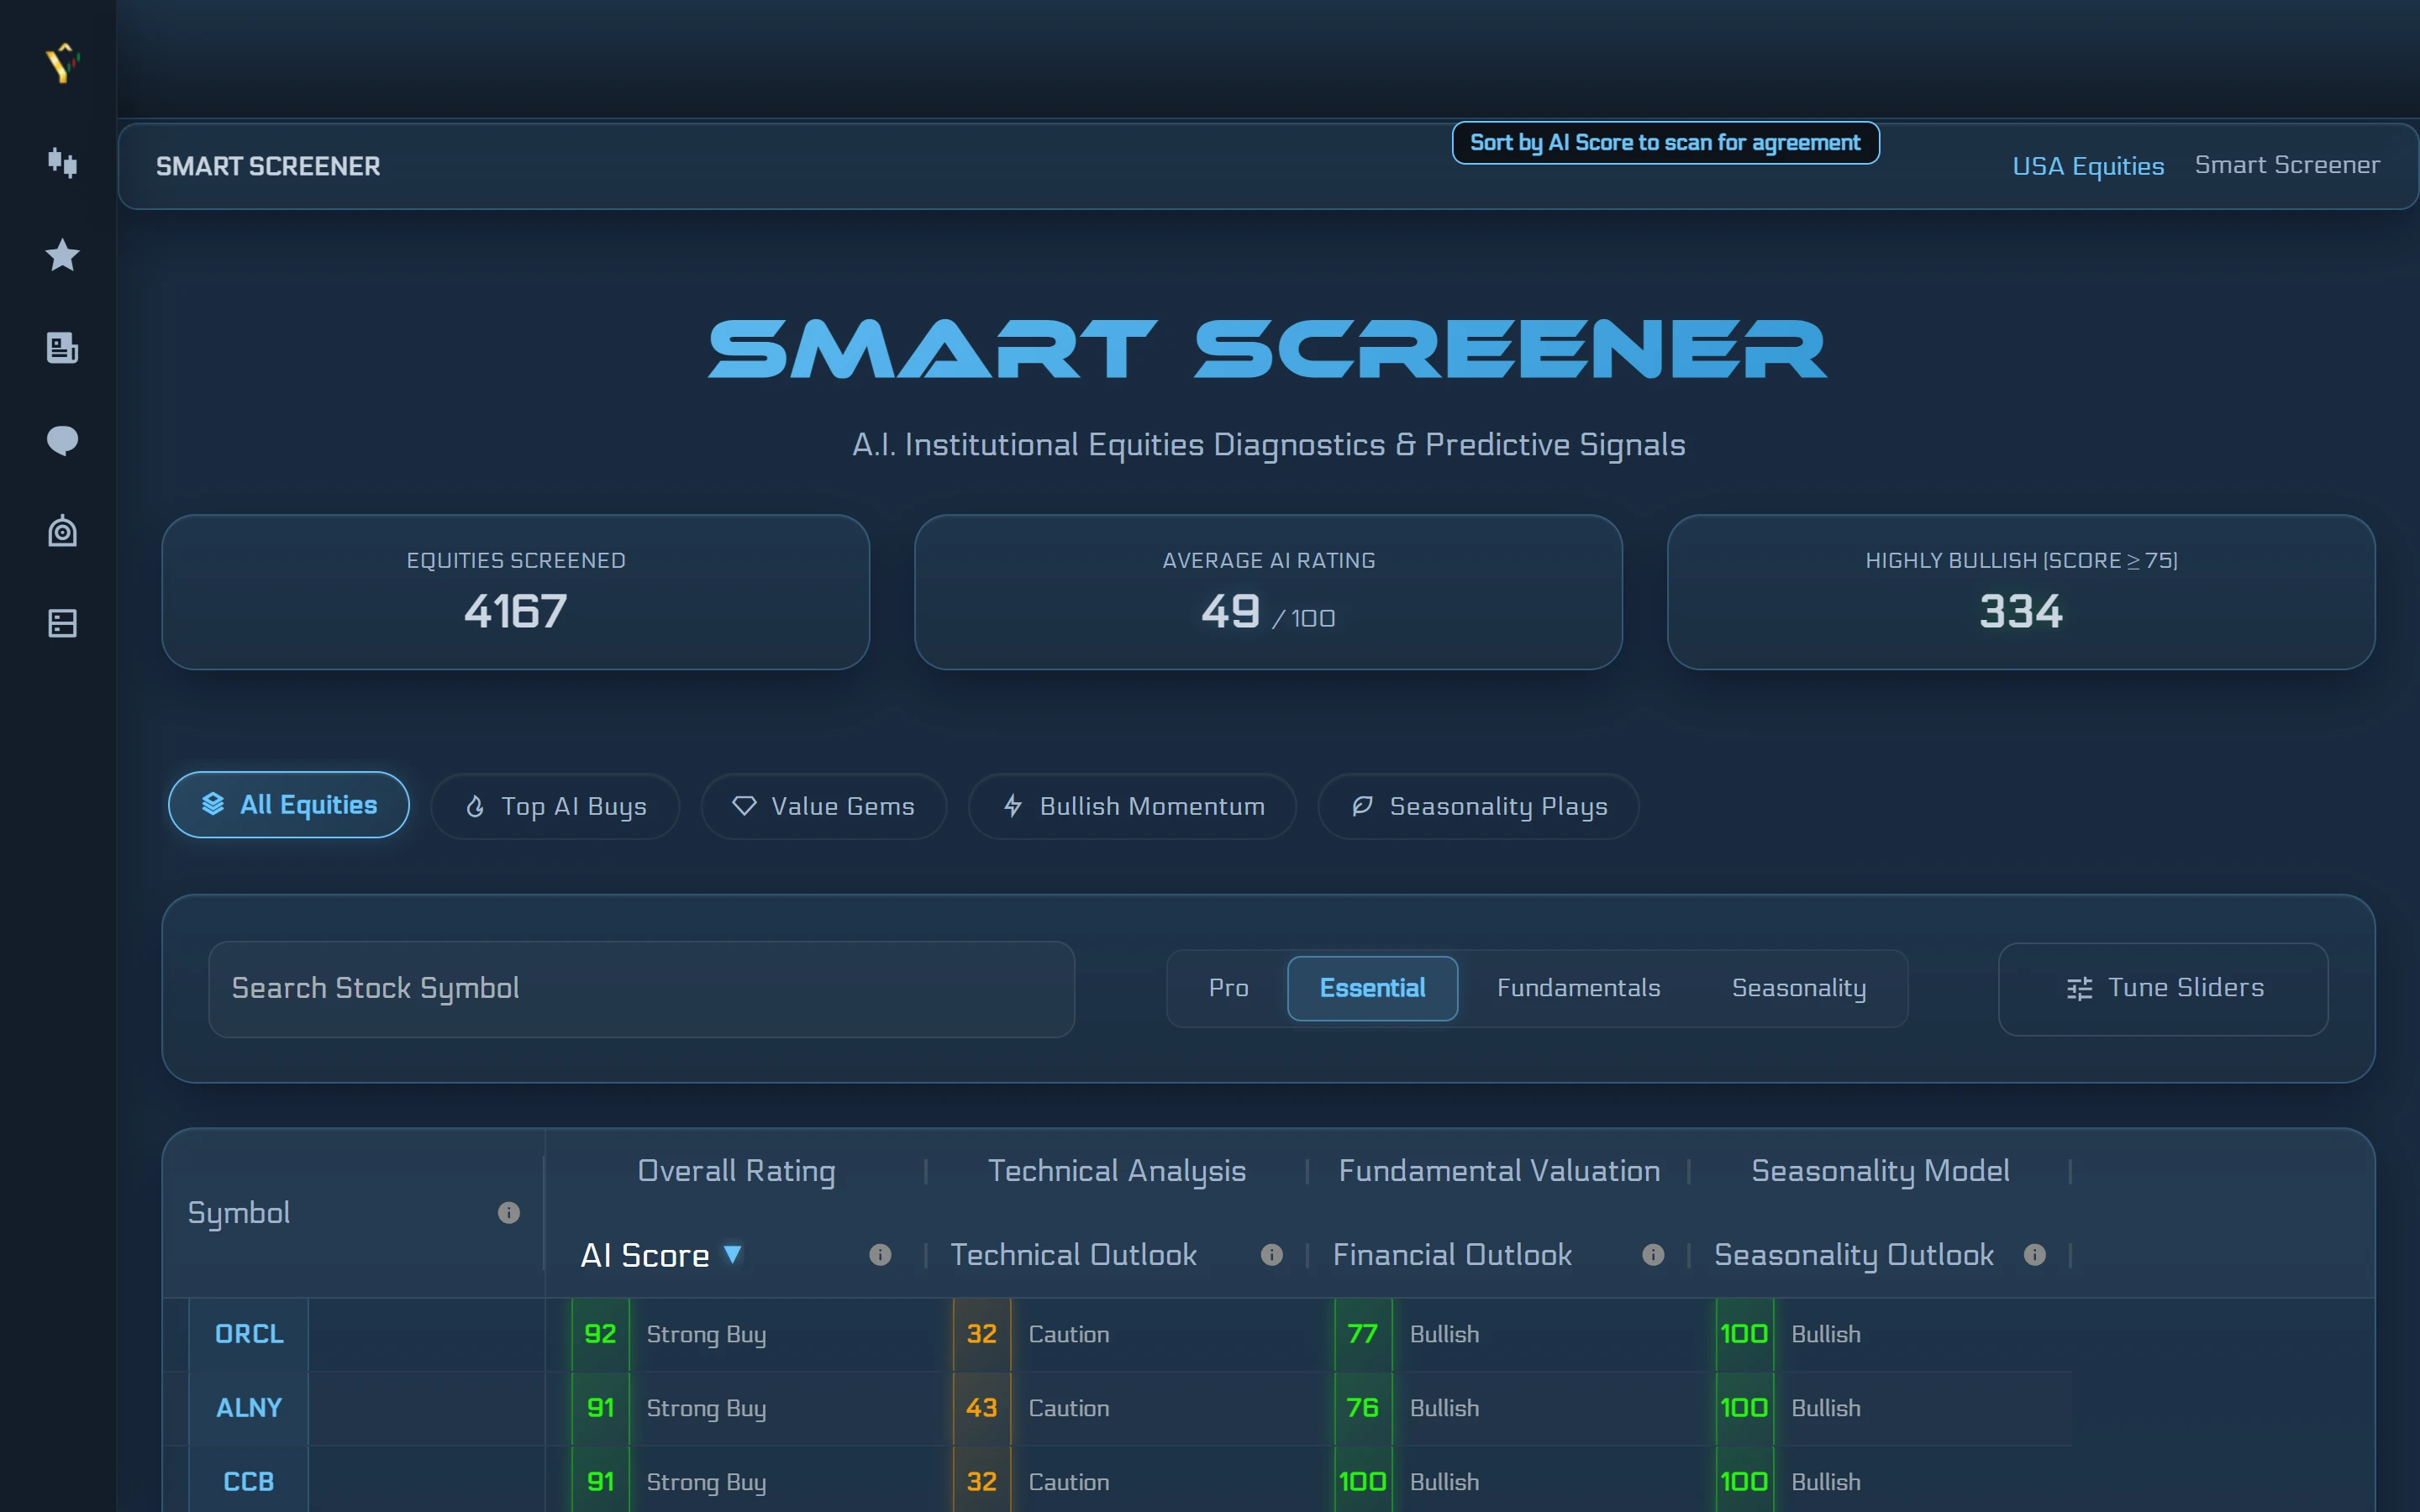
The Smart Screener opens to a single grid covering the US equities ŷRobot tracks. The page header shows three banner stat cards: Equities Screened (the total coverage count), Average AI Rating across all covered stocks, and Highly Bullish count (stocks with strong signal agreement). These give you a snapshot of the current landscape before you look at any individual row.
The grid columns are Symbol, AI Score, Technical Outlook, Financial Outlook, AI Estimation (the fair-value Valuation Gap), and P/E. Every column header has an info icon — clicking it opens a definition of that column right in the table, so you do not need to leave the page to understand what you are looking at. AI Score is the 0–100 composite; Technical and Financial Outlook represent the two broad analytical pillars; AI Estimation is the percentage gap between the model's estimated fair value and the current price; P/E is the trailing price-to-earnings ratio.
Sorting and filtering with intent
Sorting by a single column — say, picking the highest AI scores only — is a starting point, not a complete approach. The AI score is an agreement gauge across eight signals; sorting by it alone shows you where signals are aligned, but does not tell you whether that alignment is driven by valuation, momentum, fundamentals, or something else. Clicking through to the stock page shows you the breakdown.
Liquidity is a practical consideration when evaluating screener results. Actively traded names tend to have tighter bid-ask spreads than thinly traded ones, which affects the real cost of entering or exiting a position. The screener does not filter by volume automatically; that judgment is yours to apply when reviewing candidates. Looking across multiple columns — AI score alongside Financial Outlook and AI Estimation, for example — gives you more angles on a name than any single sort.
From screener to stock page
Every symbol in the screener grid is a link. Clicking it opens the full stock page for that ticker, where you can see the detailed AI Scorecard breakdown, the Fair Value card, the forecast chart, and the P/E (TTM) chart. The screener is designed as an entry point — a way to narrow a large universe down to a shorter list of names worth examining more closely.
If you find names you want to follow over time, the Add-to-Watchlist button on the stock page scorecard lets you add them directly. Your watchlist then surfaces those names in a daily digest, so you do not need to return to the screener each day to check on the same set of stocks.
Diversify with breadth
The screener covers a broad cross-section of US equities. Using that breadth to look at candidates across different sectors, rather than concentrating on a single corner of the market, is a general principle for avoiding over-concentration — not a specific allocation instruction. Different sectors respond differently to macroeconomic shifts, and signal alignment in one sector at a given moment does not imply the same for others.
The screener gives you the tools to look broadly. How you use that breadth — which sectors to include, how many names to track, how to weight different analytical signals — depends on your own context, time horizon, and judgment. ŷRobot analysis is AI-generated and quality-gated; nothing in the screener is investment advice.
Try it on a real stock
See ŷRobot's AI analysis on any U.S. stock — free, no account needed.
Analyze a Stock FreeŷRobot analysis is AI-generated and quality-gated; nothing on this page is investment advice.