Is FTI Stock a Good Buy? ŷRobot Valuation & Signals
ŷRobot Research ·

Today's Highlights:
- TechnipFMC PLC (FTI): ŷRobot's fair-value model suggests a +16% upside from its $66.30 price, with a strong bullish AI score of 89/100 as of 2026-11-13.
- Applied Materials Inc (AMAT): A significant +29% fair-value gap is noted from its $370 price, supported by a bullish AI score of 81/100 as of 2026-11-13.
- Deere & Company (DE): ŷRobot's models indicate a +14% fair-value gap from its $673 price, alongside a bullish AI score of 81/100 as of 2026-11-13.
- Ross Stores Inc (ROST): The fair-value model points to a +12% gap from its $232 price, with a bullish AI score of 80/100 as of 2026-11-13.
- Energy Transfer LP (ET): A +10% fair-value gap from its $19.40 price is observed, complemented by a bullish AI score of 80/100 as of 2026-11-13.
Market Outlook:
The broader market currently shows an uptrend under stress, marked by high volatility and an elevated stress probability. Market breadth is deteriorating, with fewer equities trading above their 200-day moving averages. While the term structure suggests no acute near-term panic, elevated implied volatility reflects underlying investor anxiety and selective risk-taking. Investors are navigating choppy, range-bound conditions as major indices test technical support levels, awaiting macroeconomic catalysts like Federal Reserve commentary, retail earnings, and key inflation data.
TechnipFMC PLC (FTI)
TechnipFMC PLC operates in the energy sector, providing subsea, surface, and processing technologies for the oil and gas industry. As global energy demands evolve, companies like TechnipFMC are critical for developing infrastructure to extract and process resources, making its performance cyclical and tied to commodity prices.
For investors asking "is FTI stock a good buy" or "what is FTI stock," ŷRobot's fair-value model offers a data-driven perspective. The model, a machine-learning regressor trained on fundamental, growth, cash-flow, and price-momentum inputs, estimates a fair value of $77.20 for FTI. Compared to its prior close of $66.30, this suggests a potential fair-value gap of +16% as of market close 2026-11-13. This gap implies the stock may be trading below its intrinsic value according to ŷRobot's analysis. For more detailed insights, explore ŷRobot FTI research.
ŷRobot's chart model currently classifies FTI as "neutral / no strong signal" as of 2026-11-13, indicating no clear bullish or bearish trend. Despite this neutral technical signal, the AI composite score for FTI stands at 89/100, with a bullish direction trend. This score is a 0-100 index that measures cross-model agreement across various signals. A high score like 89 indicates strong agreement among ŷRobot's independent models, suggesting multiple data points align in a bullish direction for TechnipFMC PLC.
Applied Materials Inc (AMAT)
Applied Materials Inc is a cornerstone of the technology sector, specifically in the semiconductor equipment industry. The company provides manufacturing equipment, services, and software to produce semiconductor chips, displays, and other advanced materials. Its performance is closely tied to the broader semiconductor cycle, which is currently driven by demand for AI, data centers, and advanced electronics.
ŷRobot's fair-value model estimates Applied Materials Inc's fair value at $479. With its prior close at $370, this represents a significant fair-value gap of +29% as of market close 2026-11-13. This substantial gap suggests that, according to ŷRobot's machine-learning analysis, AMAT may be trading considerably below its calculated intrinsic value. This model incorporates a wide array of financial metrics and market data to arrive at its estimate. You can review the full analysis at ŷRobot AMAT research.
The chart model for AMAT currently shows a "neutral / no strong signal" classification as of 2026-11-13, meaning the price action does not present a clear directional bias. However, AMAT's AI composite score is 81/100, with a bullish direction trend. This score reflects the collective conviction of ŷRobot's underlying models. An 81/100 score indicates a high degree of agreement among the various quantitative signals that contribute to the overall assessment, pointing towards a bullish outlook for Applied Materials Inc.
Deere & Company (DE)
Deere & Company is a global leader in the industrials sector, primarily known for its agricultural, construction, and forestry machinery. The company's performance is influenced by global agricultural commodity prices, farm income, infrastructure spending, and construction activity. With increasing global food demand and ongoing infrastructure development, Deere's equipment remains essential for productivity across these vital industries.
For Deere & Company, ŷRobot's fair-value model estimates a fair value of $771. Against its prior close of $673, this indicates a fair-value gap of +14% as of market close 2026-11-13. This positive gap suggests that, based on the model's analysis of fundamental, growth, and momentum factors, DE may have room to appreciate towards its estimated intrinsic value. For a deeper dive into the data, visit ŷRobot DE research.
The chart model for DE currently classifies it as "neutral / no strong signal" as of 2026-11-13, implying the stock's price action does not exhibit a clear trend. Despite this, Deere & Company holds an AI composite score of 81/100, accompanied by a bullish direction trend. This high score signifies that ŷRobot's diverse set of quantitative models are largely in agreement, with the bullish trend indicating this collective model view leans positively for DE.
Ross Stores Inc (ROST)
Ross Stores Inc operates in the consumer cyclical sector, specifically within the off-price retail segment. As a discount apparel and home fashion retailer, its business model often thrives in various economic conditions, appealing to value-conscious consumers. The company's performance is sensitive to consumer discretionary spending, inventory management, and competitive pressures within the retail landscape.
ŷRobot's fair-value model estimates Ross Stores Inc's fair value at $259. With its prior close at $232, this results in a fair-value gap of +12% as of market close 2026-11-13. This positive gap suggests that, according to ŷRobot's machine-learning analysis, ROST may be trading below its calculated intrinsic value. The model considers a comprehensive set of financial and market data points to derive this estimate. Explore the detailed analysis at ŷRobot ROST research.
The chart model for ROST currently indicates a "neutral / no strong signal" classification as of 2026-11-13, suggesting the stock's price chart does not present a clear bullish or bearish pattern. However, Ross Stores Inc has an AI composite score of 80/100, with a bullish direction trend. This score reflects the convergence of multiple quantitative signals within ŷRobot's platform. An 80/100 score points to strong agreement among these models, indicating a generally bullish outlook for ROST based on the collective evidence.
Energy Transfer LP (ET)
Energy Transfer LP is a prominent player in the energy sector, operating a vast network of natural gas, natural gas liquids, crude oil, and refined products pipelines and related assets. As a midstream energy company, its performance is driven by volumes transported and processed, providing a relatively stable revenue stream. The company's infrastructure is critical for moving energy resources from production basins to demand centers.
ŷRobot's fair-value model estimates Energy Transfer LP's fair value at $21.30. Compared to its prior close of $19.40, this implies a fair-value gap of +10% as of market close 2026-11-13. This positive gap suggests that, based on ŷRobot's machine-learning analysis, ET may be trading below its estimated intrinsic value. The model leverages a wide range of fundamental, growth, and momentum inputs to generate this valuation. For further details, see ŷRobot ET research.
The chart model for ET currently classifies it as "neutral / no strong signal" as of 2026-11-13, meaning the stock's price action does not display a clear directional trend. Despite this, Energy Transfer LP holds an AI composite score of 80/100, with a bullish direction trend. This high score indicates substantial agreement across ŷRobot's diverse set of quantitative models. The bullish trend suggests that the collective intelligence of these models points towards a positive outlook for ET, reflecting alignment in various data-driven signals.
Investing Smarter with ŷRobot:
When evaluating stocks, it's easy to place significant weight on analyst consensus ratings. While these ratings, often summarized as "Buy," "Hold," or "Sell," provide valuable context from industry experts, it's crucial to treat them as one input among many, not as definitive gospel. Analyst opinions can sometimes lag behind rapidly changing market conditions or company fundamentals, and they represent just one perspective.
ŷRobot's approach integrates analyst consensus as a weighted signal within its comprehensive AI composite score, but it's far from the whole story. The AI score, a 0-100 index, blends analyst consensus (accounting for about 10% of the score) with six other independent signals. These include the fair-value model (about 38%), seasonal forecasts, fundamental strength, and earnings beat streaks. This multi-faceted approach ensures that a stock's assessment isn't overly reliant on any single data point. For example, while analysts might have a consensus view on FTI or AMAT, ŷRobot's high AI scores for these stocks, like FTI's 89/100, reflect broad agreement across all these diverse models. This means the fair-value model, seasonal trends, and fundamental health are also aligning, providing a more robust, data-grounded perspective than analyst consensus alone. ŷRobot fuses these elements to give you a single, interpretable read on what its models collectively think, rather than leaving you to interpret disparate signals by hand.
What changed in the market
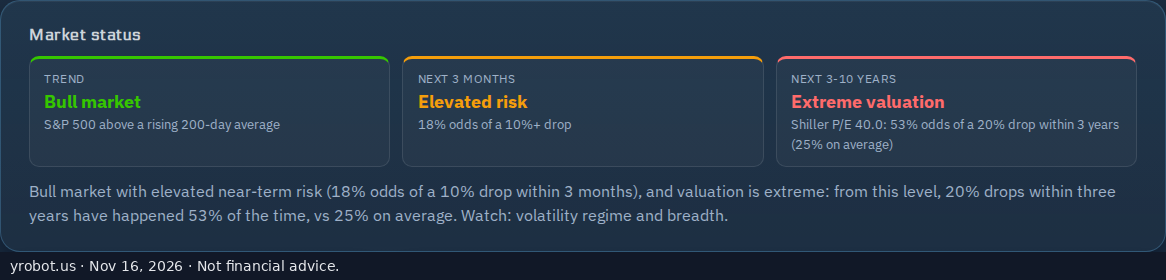
Near-term market risk is now elevated, and has held for a full week of trading. Since 2000, a 10% drop followed within 3 months 18% of the time at this level. How likely is a 10% drop in the next 3 months?
Learn more: Treat analyst consensus as one input, not gospel
Explore ŷRobot
ŷRobot is an AI-powered stock analysis platform that gives retail investors access to the same fair-value and chart-signal models featured in this article.
- Screener: Filter thousands of stocks by AI signal
- Stocks: Browse fair-value estimates across the market
- Trading Agent: Configure your own AI-driven strategy
- ŷRobot Chat: Ask our AI analyst about any stock
- Market Regime: Is it a bull or a bear market today? Seven signals, updated daily
AI-generated content disclosure: this article was generated by ŷRobot's automated analysis pipeline from the platform's own model outputs. Model outputs are statistical estimates based on historical data, are frequently wrong for individual stocks, and are not investment recommendations.
Not financial advice: all content is provided for informational purposes only and does not constitute investment, financial, or trading advice. Do your own research before making any investment decision.
ŷRobot analysis is AI-generated and quality-gated; nothing here is investment advice.