A Look Back: Market Trends and Featured Stocks for…
ŷRobot Research ·


As of 2026-11-20, the market is characterized as a stressed market without a confirmed trend, but breadth is a concern: most stocks are in downtrends. More details are available on the Market Regime page.
The Week in Review
This past week, ŷRobot's analysis highlighted several companies across diverse sectors. On 2026-11-16, five stocks were featured. TechnipFMC (FTI), a global leader in subsea, surface, and energy infrastructure projects, plays a critical role in supporting the global energy supply chain. Its price moved by -11.4% from $66.30. Applied Materials (AMAT), a key supplier to the semiconductor industry, operates in a segment foundational to modern technology. Its price moved by -18.2% from $370. Deere & Company (DE), a manufacturer of agricultural and construction machinery, is central to global food security and infrastructure development. Its price moved by -9.5% from $673. Ross Stores (ROST), an off-price retail apparel and home fashion chain, caters to value-conscious consumers. Its price moved by -8.0% from $232. Energy Transfer LP (ET), a major energy infrastructure company, is vital for transporting and storing natural gas, crude oil, and NGLs. Its price moved by -4.1% from $19.40.
On 2026-11-17, five more companies were featured. Nu Holdings (NU), a digital financial services platform, is transforming financial access, particularly in emerging markets. Its price moved by -11.4% from $12.70. YPF Sociedad Anónima (YPF), Argentina's largest integrated oil and gas company, is crucial for the nation's energy independence. Its price moved by -9.2% from $35.60. Baidu (BIDU), a Chinese technology giant specializing in internet services and AI, drives innovation and economic growth. Its price moved by -16.2% from $73.90. Allegheny Technologies (ATI), a producer of specialty materials for demanding markets like aerospace, provides essential components for high-performance applications. Its price moved by -4.2% from $173. Pan American Silver (PAAS), a primary silver producer, operates in a segment that includes both a precious metal and an industrial commodity. Its price moved by -14.0% from $35.60.
Midweek on 2026-11-18, five additional stocks were in focus. Nokia (NOK), a global telecommunications equipment provider, is fundamental to global connectivity and 5G infrastructure. Its price moved by -9.5% from $7.60. nVent Electric (NVT), a provider of electrical connection and protection solutions, is vital for power distribution and industrial automation. Its price moved by -6.6% from $109. Okta (OKTA), an identity management company, addresses critical cybersecurity and access needs for businesses. Its price moved by +7.6% from $178. Western Digital (WDC), a developer of data storage solutions, is foundational to the digital economy. Its price moved by -7.7% from $283. Baker Hughes (BKR), an energy technology company, supports global oil and gas production and efficiency. Its price moved by -5.7% from $47.50.
The week continued on 2026-11-19 with five more featured companies. Flex (FLEX), a global manufacturing and supply chain solutions provider, enables efficient product delivery across many industries. Its price moved by -11.4% from $74.80. Fidelity National Information Services (FIS), a financial technology solutions provider, is crucial for the modern financial system. Its price moved by -3.1% from $26.70. KLA Corporation (KLAC), which supplies process control solutions for the semiconductor industry, is vital for improving chip manufacturing quality. Its price moved by -12.5% from $145. Eaton (ETN), a power management company, provides solutions critical for energy efficiency and reliable infrastructure. Its price moved by -7.9% from $338. ASE Technology Holding (ASX), a semiconductor manufacturing services provider, is a key part of the chip supply chain. Its price moved by -17.4% from $31.80.
Closing out the week on 2026-11-20, five more stocks were highlighted. NVIDIA (NVDA), a designer of graphics processing units, is central to AI, high-performance computing, and gaming. Its price moved by -14.0% from $146. Jabil (JBL), a global manufacturing services provider, supports diverse industries from healthcare to automotive. Its price moved by -8.3% from $246. Ralph Lauren (RL), a premium lifestyle products company, operates in a market reflecting consumer spending and brand strength. Its price moved by -0.0% from $377. Workday (WDAY), a provider of enterprise cloud applications, is essential for modern business operations. Its price moved by +0.9% from $173. Barnes Group (B), an industrial and aerospace manufacturer, provides critical products and services for automation and defense. Its price moved by -5.6% from $33.40.
This Week's Lessons
Here are some key investing principles to consider, drawn from this week's market activity:
- Analyst consensus is useful context, not gospel; it's one input among several. Treat analyst consensus as one input, not gospel
- Seasonal patterns are tendencies, not guarantees; treat them as a small nudge. Know seasonal tendencies, but don't over-trust them
- The jumpier the stock, the wider the range of outcomes to plan for. Higher volatility means wider outcomes
- Spreading exposure across names and sectors reduces single-stock risk. Diversify; don't over-concentrate
- Charts answer what price is doing; fused models ask what it might be worth. Use the right tool for the question you're asking
The Week Ahead
No earnings reports are currently scheduled for the upcoming week.
Market Health
No confirmed trend with elevated near-term risk (18% odds of a 10% drop within 3 months), and valuation is extreme: from this level, 20% drops within three years have happened 53% of the time, vs 25% on average. Watch: trend, volatility regime and breadth.
- Trend: No confirmed trend
- Next 3 months: Elevated risk (18% odds of a 10%+ drop)
- Next 3-10 years: Extreme valuation, Shiller P/E 36.4 (53% odds of a 20% drop within 3 years, 25% on average)
- What changed this week: Trend turned cautious.
Lesson of the week: Bull or bear? What is the 200-day rule?
The 200-day average smooths daily noise into the market's long-term direction. When the S&P 500 sits above a rising 200-day average, the trend is up; below a falling one, it is down.
Right now the S&P 500 is not in a confirmed trend around its 200-day average.
Tool of the week
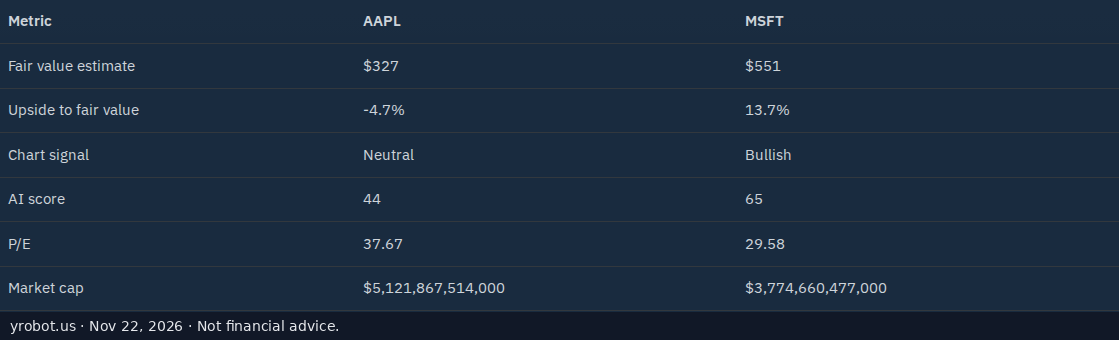
Open two tickers side by side at yrobot.us/stocks/AAPL-vs-MSFT and read the fair-value gap row first. Read the guide.
Explore ŷRobot
ŷRobot is an AI-powered stock analysis platform that gives retail investors access to the same fair-value and chart-signal models featured in this article.
- Screener: Filter thousands of stocks by AI signal
- Stocks: Browse fair-value estimates across the market
- Trading Agent: Configure your own AI-driven strategy
- ŷRobot Chat: Ask our AI analyst about any stock
- Market Regime: Is it a bull or a bear market today? Seven signals, updated daily
AI-generated content disclosure: this article was generated by ŷRobot's automated analysis pipeline from the platform's own model outputs. Model outputs are statistical estimates based on historical data, are frequently wrong for individual stocks, and are not investment recommendations.
Not financial advice: all content is provided for informational purposes only and does not constitute investment, financial, or trading advice. Do your own research before making any investment decision.
ŷRobot analysis is AI-generated and quality-gated; nothing here is investment advice.